The HBR issue (Jan-Feb 2020) spotlights “The Loyalty Economy” which makes for a great read for anyone interested in business growth. This three-article series eloquently illustrates how the myopic quarterly investor reporting has stunted long-term growth for many businesses. At the same time, true leaders like Amazon’s Jeff Bezos, Costco’s Jim Sinegal, and Vanguard’s Jack Brennan focused on customers and had the last laugh. In the first article, Rob Markey of Bain recommends three important auditable metrics that reflect a healthy growth of customer value viz.
- The number of gross new customers acquired during the reporting period and the number of net new customers remaining at period end.
- The number of existing (tenured) customers
- revenue per new and existing customers
This aligns perfectly with our experience in measuring an outcome-based digital transformation deal that we did for a large multi-billion dollar division of a CPG major. We have demonstrated results of 5-7% growth in topline revenues, 60-75% call deflection, and 97% satisfied customers while simultaneously building a greenfield B2B eCommerce system and upgrading the call center technologies.
What customer measurements helped us achieve 5-7% growth in revenues and 97% satisfied customers?
As part of this transformation, we very closely monitored
- the total number of customers ordering in the reporting period,
- the number of customers acquired in that period
- the number of customers who have NOT ordered in the last 3 reporting periods
- the number of customers who have taken to ordering online
- the number of clicks /calls it took to place an order
- Customer feedback on the online system every quarter
with a double click into each of the above numbers by segments. We further diligently reviewed the trends of these numbers accounting for seasonality based on prior year history and adjusting for customers who declared themselves seasonal. Let us double click on the actionable metrics from this list.
Customers acquired in that period :
We compared this metric, period-over-period, and analyzed the campaigns that contributed to the growth. We further broke these numbers down by customer type and geography to learn what was going well from growth segments and campaigns to apply them broadly.
Customers who have NOT ordered in the last 3 reporting periods:
This was a lagging indicator of attrition. However, any corrective action taken 3 periods would be too late, by which time the customers had already settled in with the competitor. So we used this metric as a benchmark, but the actionable list was created by using analytics (and later ML) to come up with better predictors of who is most likely to leave, based on prior trends. For example, we noticed a pattern that customers who were leaving typically would stop ordering a certain product category and that became our early warning to reach out to them.
Customers who have taken to ordering online:
We ran campaigns to encourage the customers currently ordering over the phone to go online instead. While we debated offering incentives (such as “get $x off your nth online order”), after comparing notes with the online leader in the foodservice industry, we decided against it as the 24×7 online experience itself was the incentive to migrate. And we stopped calling the customers for orders in select markets as an experiment and the numbers proved to us that there was no drop in customers or revenues. That satisfied the critics within the leadership who did not want agents to stop calling, and we saw the adoption increase to tens of thousands of customers.
Clicks to order :
This was a B2B scenario where the majority of customers knew exactly what they want when they come back for their weekly/fortnightly orders, and hence this metric was vital to understand the friction in the process. Our effort was to make the process as quick and frictionless as possible for these customers, who, we learned from our route rides that they don’t have much time to spend on ordering, and they were also suffering from campaign /sales fatigue and hence just wanted to get their order in. Our UX design resulted in 60% of the orders being placed in 3 clicks (screens), and over 75% of the orders being placed in under 5 clicks. Our UX design to accomplish the pre-population of the cart for these customers using analytics and ML is a topic for another post.
Customer feedback loop :

We believe one of the key enablers for our success was the closed-loop feedback mechanism that we created within the system. After each major website upgrade release (typically once a quarter), we presented a short feedback-form after the order confirmation screen that asked customers to rate their ordering experience 1 (Bad)-5 (Excellent) and monitored it diligently. We kept it very simple for them to just 3 questions (how easy was it to find products, how easy was the ordering process, and how do they rate the overall experience?) where they can select 1-5 and a free format text box to add any other feedback. To address customer dissatisfaction promptly, all feedback with a 1-3 rating was automatically raised as a ticket to an agent. This resulted in a call back ASAP from an agent to inquire about their feedback and disposition it accordingly in a timely fashion. This, we believe, helped matters significantly in a) redressing the grievance of an unhappy customer before they decide to start looking elsewhere and b) letting us know in real-time the issues bothering customers so we could apply systemic fixes/ provide better educational material/ train agents accordingly. There were several other techniques that helped us accomplish these results, some of which are further described here.
In summary, the key actions we took after periodically analyzing the customer metrics and insights were to:
- Establish a feedback loop to have a human agent reach out and address all reports from dissatisfied customers within the next day or two while the issue is fresh and has not caused long term impact.
- Update help documentation, on-screen prompts, or videos
- adjust the campaigns
- change the SOP of agents as needed
- adjust the requirements of our quarterly releases
- create /adjust automated alerts to operators and agents, triggered by monitoring specific trends.
 In the previous post, we discussed an example of handling a “No” by finding out a manual workaround where the integration was not critical, at least in the short term. Many times this is not an option, and it is a make-or-break situation where we need a change made to an external system (one which we have no control over) to meet our program objectives. However, that other team is not able /willing to support us. We hit a wall. Now what?
 A key trait, — something that I always look for while hiring my team — is the ability to Get Stuff Done. I had been brought in to several rescue efforts where key commitments got delayed in spite of having a technically brilliant team, using Agile, DevOps, etc, only because the GSD attitude was missing across the enterprise. I realized this is not something that is taught in any class or course, but this is what truly makes or breaks the on-time delivery. Hence this series of posts.
  software almost from scratch, a microkernel, device drivers, application code, global data tables, all “burnt” into an EPROM (we later started using flash drives in 1993). The station-specific data was stored in a separate pluggable sealed cartridge with its own EPROM – with an internal rechargeable battery. The transaction data was stored both on the main system as well the cartridge, so in case the main system went down for any reason, (Plan B) the booking clerk can plug it into another working system and continue their shift. As a further precaution (Plan C) in case the whole station loses power or is down for any reason, I designed it such that the cumulative cash collected until that point is printed in a simple codified way on top of the next (not yet sold) ticket. In this image (randomly picked up from Google) the code JFBA on the top-left indicates the cash amount of 9510 rupees collected in that shift until and including the previous ticket sold.
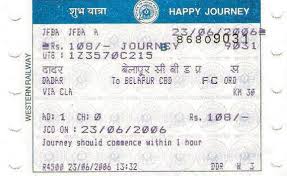 The purpose of this was so they can at least close their shift and remit the cash as shown by the code and go home. This is also how I built in the distributed auditing aspect into the system because when each ticket is sold to a passenger (with the cumulative cash collected in that shift recorded on the top of that ticket), they traveled with it to a far off station, where (many of) those tickets were collected by the station staff at the exit gates and stored. The majority of the booking clerks enjoyed the benefits of a quick shift closing with the click of a button and did not have to manually account for the card ticket stock, cutting down their shift closure from almost 30 minutes to just 2 minutes.
 on, but the railway officials were missing information to prove the exact amount embezzled and other specifics. On the surface, everything seemed perfect with the end of shift reports showing the (lower) amounts collected, which were deposited accordingly. We noticed that there was a gradual reduction of the amount over a period of a few months. (Apparently, the staff started small, and when no one caught them they became greedy and bolder as months went by- which incidentally caused a bigger dent in the revenues, big enough to get attention). Earlier there seemed to be a healthy mix of high value (long-distance) tickets and low value (short distance) tickets in a shift, depending on the train schedules. But recently, all tickets were reported to be sold for shorter distances and hence the low revenues. Prima facie the reports tallied, the ticket stock was properly accounted for. So they sealed all the systems in that station which they believed were somehow tampered and had replacement systems and staff to keep the show going on while suspending the supervisor and a few suspected clerks. Now they needed proof and specifics. As the designer of the system, I was asked to be on the investigation team and visit Surat along with other railway officials. We were provided police protection even before we reached Surat station given the stakes involved.
 Trenitalia’s first class was good with 3 +3 seat cabins with doors. Unlike other trains that had a 2+1 configuration, this had 3 seats in a cabin with the passage on the side so one could sleep across these 3 seats as they were contiguous and the hand rests can be folded up. Ours was the last car of the train so we had a good view from the back vestibule door.
 Reached MonteCarlo around 7:45pm. Took a taxi to the Marriott hotel to check into a beach-view room. We headed out for dinner to
  Teja and I spent some time on the beach next to the hotel in the morning. Came back to the hotel and spent more time in the pool. Visited the Castle (from the outside- we missed the change of guard which happened earlier).
 Drove around on the middle road and reached the station to buy a ticket to Nice. The train to Nice was really crowded. Our original plan was to stay in Nice but changed it after the recent sad incident. We already bought the tickets to Paris on the TGV leaving Nice at 3:02 pm. Had an hour at the Nice station, so I found an Indian restaurant nearby and got some vegetarian dishes packed for the journey. They run two TGV trains attached to each other, the regular TGV and the IdTGV (the best source for info on European trains is
  The TGV runs at low speed continuing the journey over the French Riviera coastline onto Antibes, Cannes, Marseilles, and Avignon. From there it goes non-stop picking up its famous 320 kmph speed. Reached Paris Gare de Lyon on time at 8:40 pm, had dinner at an Indian vegetarian restaurant near Gare de Nord and checked-in to the Marriott Rive Gauche hotel.